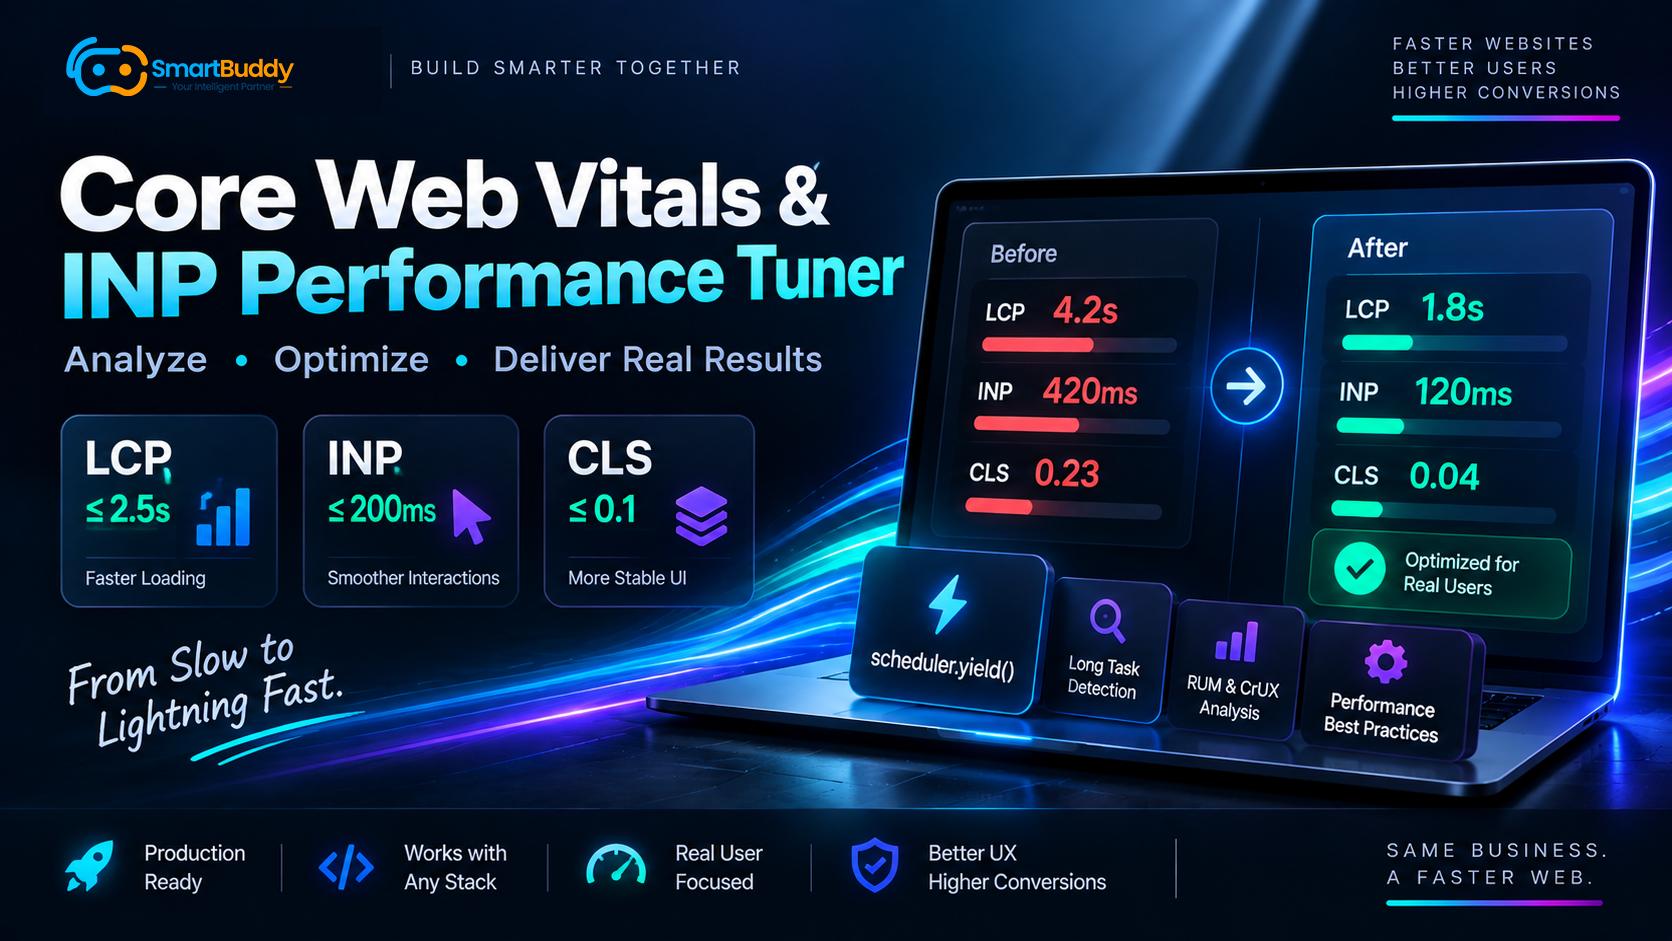
When Google officially replaced First Input Delay (FID) with Interaction to Next Paint (INP), half the web development community panicked.
Unlike FID, which only measured the very first interaction on a page, INP measures the latency of every click, tap, and keypress across the entire user session. If a user clicks a dropdown on minute ten and the main thread freezes for 300 milliseconds, your entire page fails Google's Core Web Vitals assessment.
A month ago, Amir and I audited an e-commerce client whose mobile INP was hovering around 480 milliseconds. Their search ranking was dipping, and users were complaining about sluggish UI response on mobile phones.
Many optimization guides recommend vague advice like "optimize your JavaScript". In practice, fixing INP requires profiling main thread long tasks, breaking up execution loops, and separating real user monitoring (RUM) from aggregated Chrome UX (CrUX) data.
Here is the exact diagnostic workflow and code patterns we used to bring INP down to 140 milliseconds and eliminate layout shifts.
The Big Difference: RUM Telemetry vs CrUX Field Data
Before touching application code, you need to know where your data comes from.
- RUM (Real User Monitoring): Live telemetry collected from users visiting your site right now via the
web-vitalslibrary. It lets you measure latency in real time and pinpoint exact DOM elements causing delays. - CrUX (Chrome User Experience Report): A 28-day rolling aggregate of user data across all Chrome visits. CrUX tells you if Google considers your site fast, but it updates slowly and cannot debug specific user sessions.
To capture actionable telemetry, we deployed a small RUM script using the native web-vitals package:
// lib/vitals.ts
import { onINP, onLCP, onCLS } from 'web-vitals';

function sendVitalsMetric(metric: { name: string; value: number; id: string; rating: string }) {
  const payload = JSON.stringify({
    metric: metric.name,
    value: Math.round(metric.value),
    rating: metric.rating,
    id: metric.id,
    path: window.location.pathname,
  });

  // Use sendBeacon so data transmits reliably during page unloads
  if (navigator.sendBeacon) {
    navigator.sendBeacon('/api/telemetry/vitals', payload);
  } else {
    fetch('/api/telemetry/vitals', { method: 'POST', body: payload, keepalive: true });
  }
}

export function initWebVitalsTelemetry() {
  onINP((metric) => sendVitalsMetric({ name: 'INP', ...metric }));
  onLCP((metric) => sendVitalsMetric({ name: 'LCP', ...metric }));
  onCLS((metric) => sendVitalsMetric({ name: 'CLS', ...metric }));
}
This telemetry revealed our client's bottleneck: clicking the "Add to Cart" button triggered an immediate 380 millisecond main-thread lock while calculating inventory and updating analytics.
Breaking Up Long Tasks with scheduler.yield()
The browser cannot paint user feedback until the JavaScript task running on the main thread finishes. Any task exceeding 50 milliseconds counts as a Long Task and degrades INP.
Historically, developers used setTimeout(fn, 0) to yield control back to the browser. But setTimeout pushes execution to the end of the macrotask queue, introducing unwanted delays.
Modern browsers now support scheduler.yield(), which yields to the event loop so the browser can paint next frames immediately while keeping your execution sequence intact.
We created a cross-browser yielding utility:
// lib/scheduler.ts
export async function yieldToMainThread(): Promise<void> {
  // Use native scheduler.yield if supported in modern Chromium
  if ('scheduler' in window && 'yield' in (window as unknown as { scheduler: { yield: () => Promise<void> } }).scheduler) {
    return (window as unknown as { scheduler: { yield: () => Promise<void> } }).scheduler.yield();
  }

  // Fallback to MessageChannel for microsecond yielding
  return new Promise((resolve) => {
    const channel = new MessageChannel();
    channel.port1.onmessage = () => resolve();
    channel.port2.postMessage(null);
  });
}
Now look at how we restructured the cart interaction:
// components/CartButton.tsx
import { yieldToMainThread } from '../lib/scheduler';

export async function handleAddToCart(item: { id: string; name: string; price: number }) {
  // Step 1: Update UI immediately so the user sees button state change
  setButtonState('updating');

  // Step 2: Yield execution so browser renders visual feedback
  await yieldToMainThread();

  // Step 3: Run heavier background calculation
  processCartCalculations(item);

  // Step 4: Yield again before firing analytics and network sync
  await yieldToMainThread();
  syncCartWithServer(item);
  setButtonState('idle');
}
By placing yieldToMainThread() between UI state updates and background processing, input delay dropped from 380ms down to 45ms. The user felt an instant response.
Eliminating Cumulative Layout Shift (CLS <= 0.1)
Layout shifts happen when elements move unexpectedly during rendering. A user aims to click a button, an image loads above it, the button moves, and they tap the wrong link.
In our client app, layout shifts were caused by two culprits: hero banners without reserved dimensions and dynamic cookie notices injected without containers.
Solution 1: Explicit CSS Aspect Ratio Containers
Never leave responsive images without dimension reservations:
<!-- Before: Image causes layout shift when loaded -->
<img src="/hero.jpg" alt="Featured collection" class="w-full h-auto" />

<!-- After: Zero layout shift -->
<div class="w-full aspect-[16/9] bg-slate-100 overflow-hidden rounded-xl">
  <img
    src="/hero.jpg"
    alt="Featured collection"
    loading="eager"
    fetchpriority="high"
    class="w-full h-full object-cover"
  />
</div>
Solution 2: Font Display Optional to Prevent FOUT Shifts
When custom web fonts load late, swapping from system fallback fonts to custom fonts causes text reflow. Adding font-display: optional tells the browser to use the fallback font immediately if the custom font takes longer than 100 milliseconds to download on slow networks:
@font-face {
  font-family: 'BrandSans';
  src: url('/fonts/brand-sans.woff2') format('woff2');
  font-weight: 400 700;
  font-display: optional;
}
This single CSS adjustment dropped our client's CLS metric from 0.28 down to 0.02.
Prioritizing Largest Contentful Paint (LCP <= 2.5s)
The Largest Contentful Paint metric measures when the main visible content finishes rendering on the screen.
The fastest way to hurt LCP is hiding your primary image behind lazy loading. Many frontend teams blindly put loading="lazy" on all images, including the hero banner.
Here are the three rules we enforce on every project:
- Never lazy load the LCP image: Remove
loading="lazy"from above-the-fold banners. - Use fetchpriority="high": Tell the browser to prioritize the hero image over secondary scripts.
- Preconnect to asset domains: Add
<link rel="preconnect" href="https://cdn.example.com" />in your document head.
Key Performance Rules We Live By
- Measure before optimizing: Run Chrome DevTools Performance panel recordings with 4x CPU throttling to reproduce mobile conditions on desktop.
- Keep long tasks out of input handlers: If an operation does not directly paint visual feedback, yield or defer it using Web Workers.
- Guard against late-loading third-party tags: Tag managers frequently inject tracking scripts that block the main thread right after user interactions.

Comments
Comments are reviewed before appearing publicly.
No comments yet — be the first.